A good monitoring system is indispensable for optimizing IT system administration and increasing efficiency. All the data stored in the monitoring systems and logs is really important both for predicting problems and being proactive. At Stackscale we are aware of the importance of system monitoring services, that is why we integrate them in every project of platform sysadmin, either directly or together with our partners.
Knowing how the systems and their configurations have been deployed is essential to act properly when necessary. As well as using tools that provide you with the detailed information of every virtualized or physical server, storage, Linux and Windows systems, databases, etc. At the end of the article we will talk about some useful system monitoring tools.
Why monitor any system 24×7?
Because a real-time view of the data and logs generated by your eCommerce, website or any other platform hosted in the cloud is extremely useful. Monitoring allows you to anticipate in order to detect vulnerabilities and bottlenecks, improve services and, of course, avoid and solve any problem — even before it shows up.
Main reasons why you should monitor your IT systems and servers 24×7
Setting up a system to monitor servers, systems and services is really important. Here we have collected the main reasons why 24×7 system monitoring is an essential part of system administration services:
- Anomaly and error notifications. You can have alarms that warn you when something isn’t working properly or when something runs the risk of getting to a point of failure.
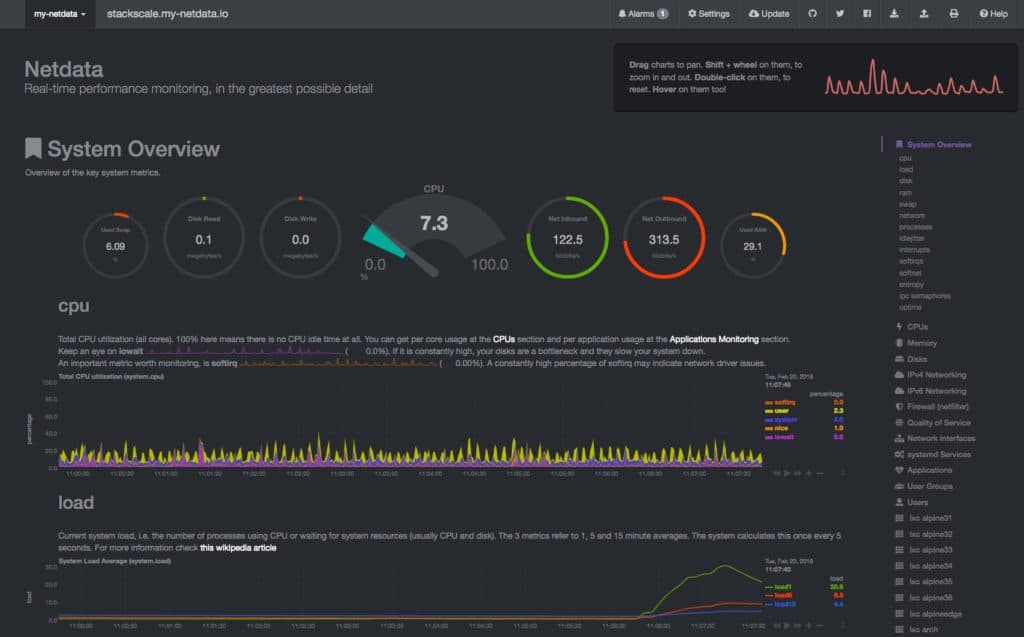
- In-depth performance knowledge. With tools such as Netdata you can know your servers’ performance in detail. Moreover, you can use Wanguard for measuring traffic and combine it with Newrelic to know further details of the software and many other tools.
- Centralized logs system. Logs are like the bible for searching errors and system failures. Ideally, you should rely on a centralized logs system; if possible, a real-time one.
- Critical events detection. System monitoring allows to detect the origin of critical events.
- System optimization. The statistics you will have over time will give you a vision of when your needs increase and decrease. Thanks to these data, you will be able to anticipate and optimize your systems in the future.
- Cost-efficiency. Together with the maintenance and system administration, 24×7 monitoring allows to increase efficiency and reduce costs.
Both the platforms managed internally by Stackscale’s team and the platforms managed by our partners count on advanced 24×7 monitoring systems; which are supported by a team of professionals who are always available to take action when necessary. By relying on a team of system administrators + monitoring, you will make the most of your resources and infrastructure. You will also reduce costs, optimize many processes and, of course, improve your customers’ experience.
How does system monitoring work?
Having the right tools for monitoring is as important as defining the methods you will use and deciding the KPIs that are to control. Every process of IT system administration and monitoring starts with a previous study of the requirements; which can be followed, if necessary, by an auditing of the systems and the security.
If the platform is new, the ideal systems’ architecture will be specifically defined for each project; weather it be an eCommerce with Magento, a high-traffic WordPress or a custom development. Additionally, from the moment the new (or current) architecture starts taking shape, a map of the elements that will be part of the monitoring system is developed; together with the action protocols.
All this must be supported by a team of experts responsible for ensuring the 24×7 monitoring service, who can take action at any moment if necessary; as we do at Stackscale together with our partners providing system administration services.
Useful tools to monitor IT systems
Tools to view and get real-time metrics
Netdata
Netdata is an open source tool that allows to display and monitor metrics (KPIs) in real time. It allows to control almost everything and store data for future consultation. With Netdata you can control data such as CPU consumption, disk activity, SQL requests, etc.

Netdata is installed like a daemon in the system and it gets information in real time, second by second, to display it on a dashboard with a functional and visual design. It is a very light tool, mostly written on C. It barely uses a 2% of the CPU in an only thread and a few megabytes of RAM to run and collect data in real time.
Monitoring tools
Zabbix
Zabbix is another network monitoring system which has displaced Nagios in many cases. This system works with the following databases: MySQL, PostgreSQL, SQLite, Oracle and IBM DB2. The backend of Zabbix is written on C and the web frontend is written on PHP, which makes the modification of the public part easier.
Pandora FMS
Pandora FMS is an open source monitoring software to monitor systems, applications, TCP/IP services, network systems, etc. Pandora FMS allows to consult data over time thanks to its data and event log, collect information in almost any operating system and send warnings when there is a system failure, among other functionalities.
Nagios
Nagios is an open source system for monitoring networks and servers that works on any operating system and allows to control both hardware and software, among other possibilities. Among its main features there are the monitoring of network services (SMTP, IMAP, POP3, HTTP, HTTPS, SNMP, etc.) and monitoring of hardware systems’ resources (processor load, disk usage, RAM memory, fan condition, port condition, etc.).
Nagios offers many customization and configuration possibilities; it allows, for instance, to connect its alarm system to send warnings via email, SMS, Telegram, etc., and it can even be connected to a switchboard to make calls.
There are many other system monitoring tools such as Cacti. Each sysadmin department and system administration team must decide which one meets its needs better.


